

- Investing
With the UK stock market ending 2025 on close to a record high - and entering 2026 on a similarly strong note - can UK investors look forward to a more positive outlook this year?

At a glance
- The FTSE 100 recently broke the 10,000 milestone after a strong 2025
- Historically, pessimism about the make up of the index has weighed on performance
- Sentiment has started to improve, with investors attracted by the FTSE's defensive qualities, low valuations and generous dividend yields.
UK shares – the right mix at the right time?
With the UK stock market ending 2025 on close to a record high – and entering 2026 on a similarly strong note – can UK investors look forward to a positive outlook in the year ahead?
The FTSE 100 surprised many investors by rising 21.5% in 2025, its strongest calendar year performance since 2009. This was one of the highest annual returns of the major global stock markets. 2026 also began strongly, with the FTSE 100 reaching the 10,000 milestone in the first days of the new year. Yet with increasing geopolitical turmoil expected due to the situation in Venezuela, can this continue and what might lie ahead?
For the UK’s main stock index to outpace those in the US and Europe might have seemed unlikely to many investors a year ago. The FTSE 100 is often criticised for being dominated by stable “old economy” sectors such as financials, mining and consumer staples (food and consumer goods manufacturers). Unlike the US, it has much lower direct exposure to faster growing industries like artificial intelligence (AI) and the technology sector more broadly.
Yet with valuations for many AI-linked companies in the US at record levels, and broader market returns dominated by the technology sector, there have been signs of an increasing desire to diversify into more attractively priced alternatives. In recent months this has benefited the UK. Will it continue?
Initially it was all about the US...
12 months ago, the S&P 500 looked set for another stellar year, fuelled by optimism around a second Trump administration, excitement around AI and strong corporate profitability coupled with upbeat economic data. While there was indeed continued optimism around AI, this was balanced by growing concerns over actions of The White House, particularly over its imposition of harsh tariffs. This came to a head in April when the announcement of ‘Liberation Day’ tariffs led to significant weakness in US assets. Although the US market did recover its poise over the remainder of the year, it seemingly increased the appetite of investors to look at opportunities outside of the largest equity market in the world.
Why UK shares became cheaper
Following Brexit, many analysts were concerned how the UK would cope with the extra costs and reduced access to its largest trading partner, the European single market. Over time, these doubts crystallised in the form of a lower price-earnings valuation for the UK. Leaving aside the brief post pandemic distortion, these reduced valuations reflected what investors saw as the higher risks and lower growth prospects for UK-listed companies.
Since Brexit, the UK market has fallen out of favour
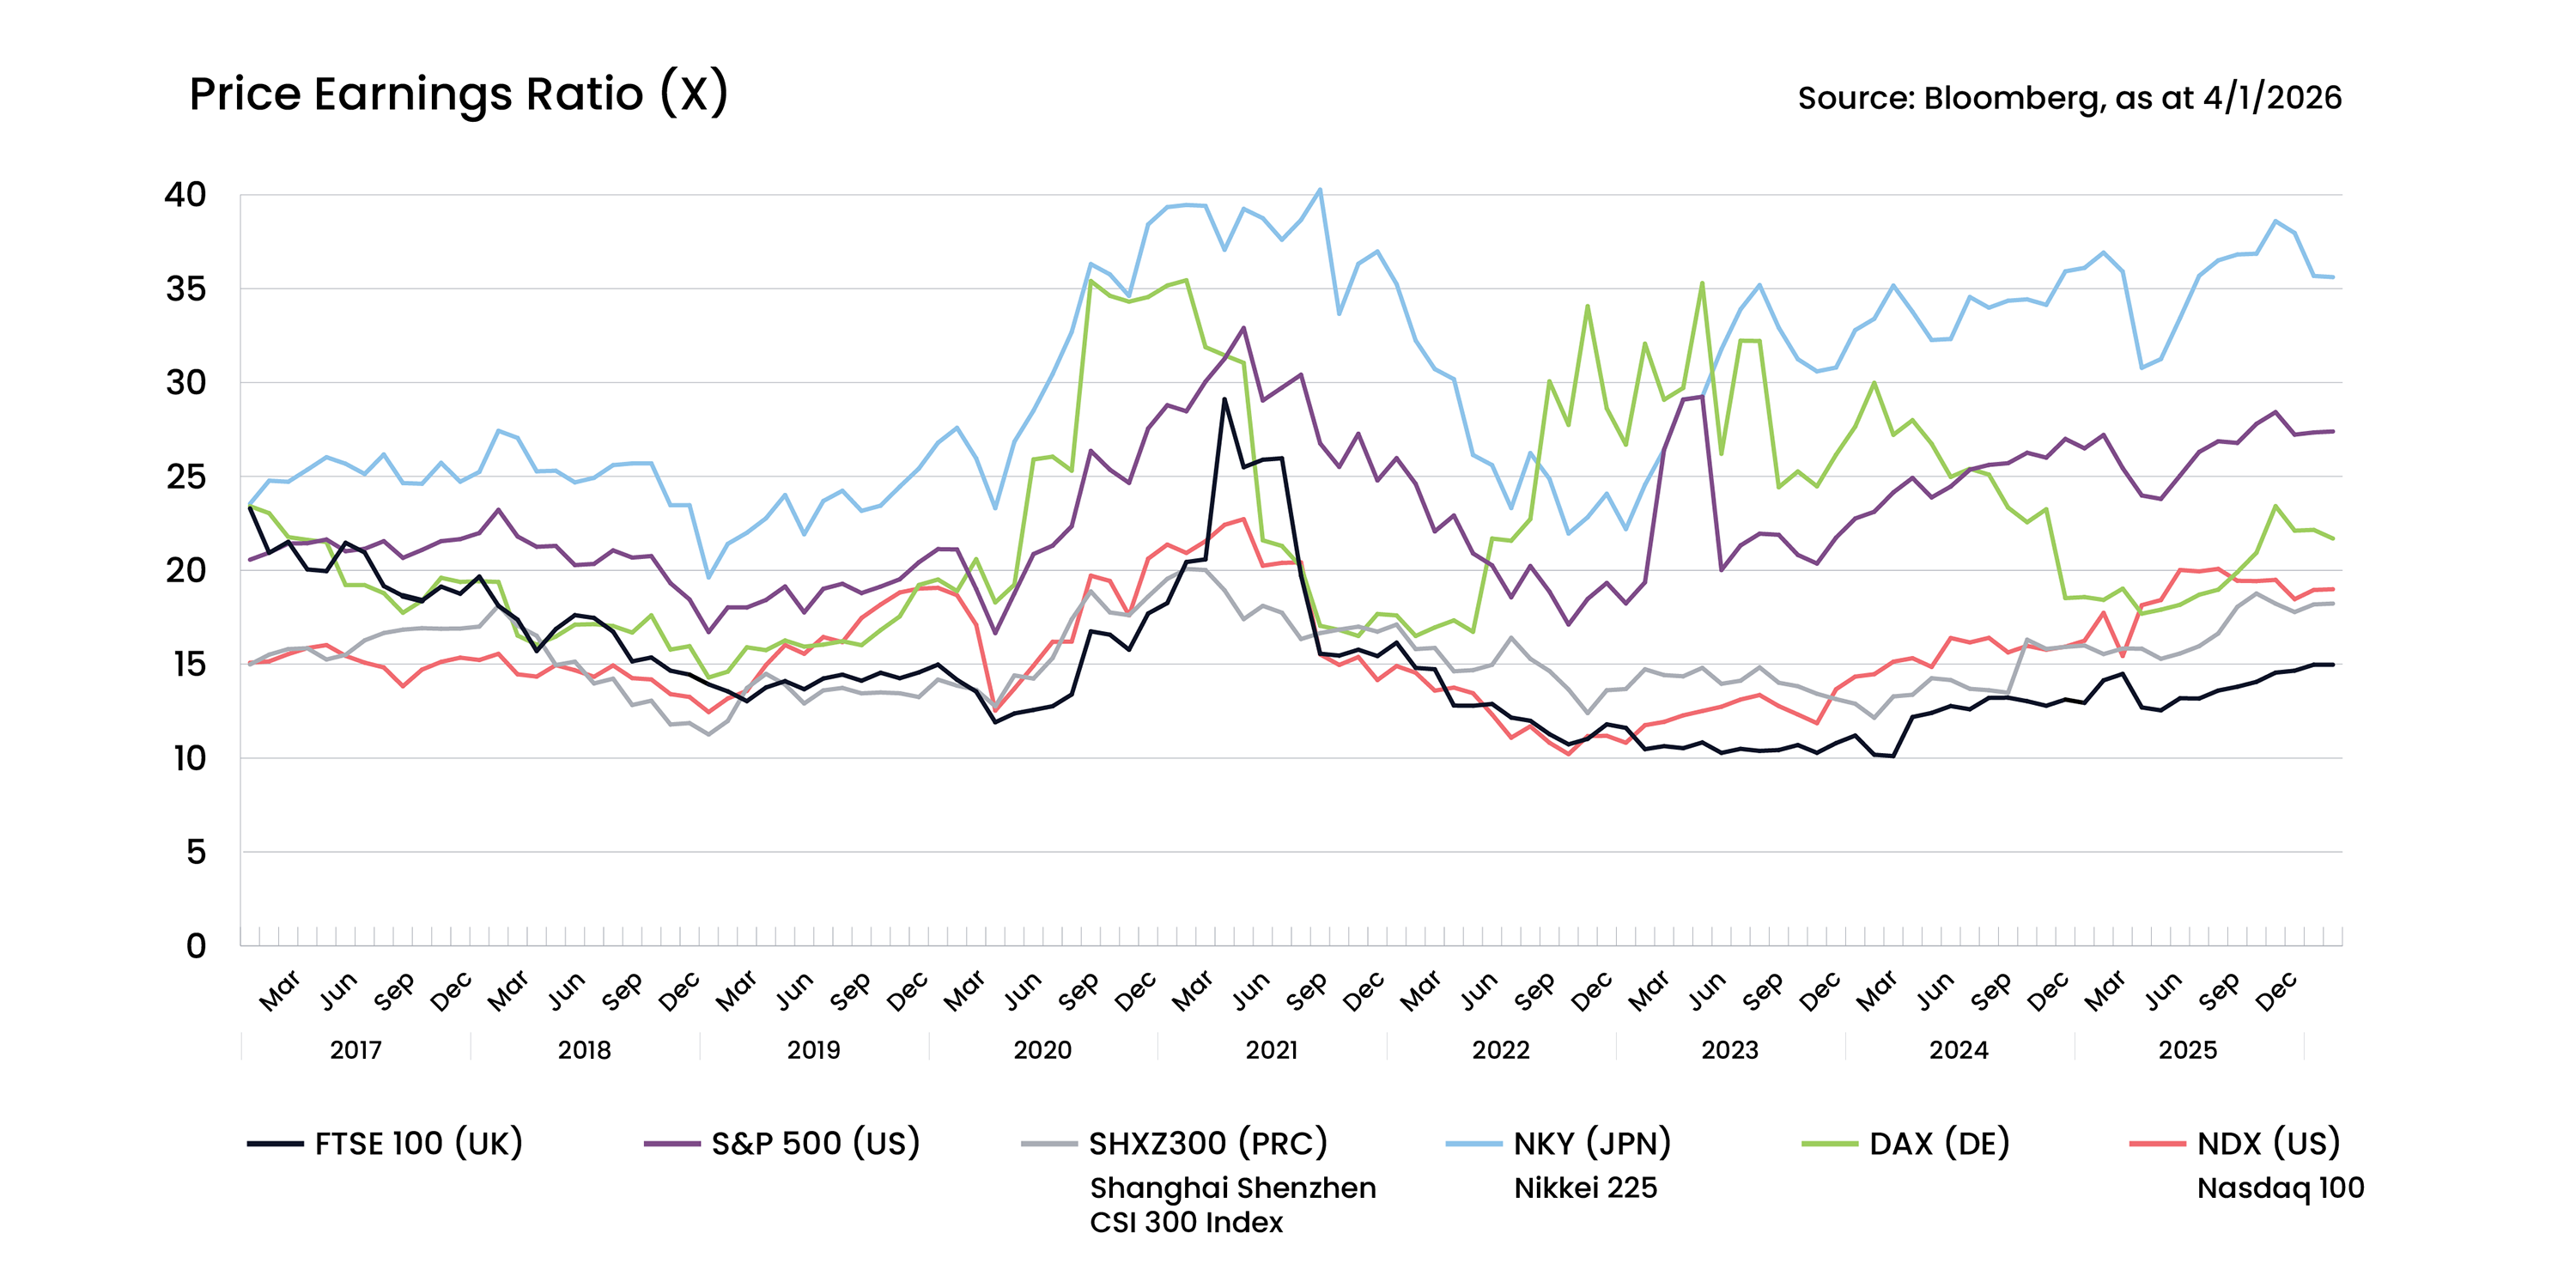
Past performance is not indicative of future performance.
Please note, it is not possible to invest directly into an index and the figures shown do not take into account any charges applicable to the appropriate investment wrapper or any relevant tax charges.
The UK market has a distinctive mix of companies with a bias towards “traditional” sectors such as financial services and manufacturing. It remains a world leader in banking and insurance, although some areas, such as automotives and steel manufacturing have been lost to lower cost operators in Asia and elsewhere.
The UK stock market’s global ranking has shrunk since the end of the 19th century, when it was the world’s largest. In the MSCI ACWI Index, a commonly used proxy for global stock markets, the UK’s share of the global stock universe is now just 3.3%1.
Yet, despite much recent comment about the health of the UK stock market, it is still the world’s third largest by value. Despite having a much smaller economy, the UK’s market weighting is just ahead of China2. However, it is way behind the US, which leads the global universe with 65% of the total market3.
The wrong type of shares?
One of the drawbacks with the UK stock market has been limited exposure to the sectors and industries that have delivered the highest levels of sales and earnings growth in recent years. The MSCI UK sector breakdown shows there is little exposure to information technology (1.1% weighting), or communication services (2.1%)3. These areas are at the forefront of the global AI revolution.
In comparison, taking a look at the global MSCI ACWI shows the technology sector makes up 27% of total exposure, with a further 9% in communication services. This discrepancy is even greater in the MSCI USA. Here technology and communication services make up almost half (47%) of index exposure.
In contrast, the UK is underpinned by many sectors regarded as dull or defensive, with steady but seemingly unexciting earnings growth. It remains dominated by financials, accounting for 25% of the total MSCI UK market value, followed by consumer staples, energy companies and commodity producers.
Headwinds become tailwinds
What propelled the UK to the top of the rankings in 2025? With a high proportion of FTSE 100 earnings from operations overseas, these companies saw benefits from the reduction in global tariff tensions. Domestically lower inflation and falling interest rates also proved supportive.
What helped the UK market stand out has been improved investor sentiment towards many previously unloved “old economy” sectors. Banks and financials do well when interest rates fall. Elsewhere, the mining sector has been supported by a commodity boom. This has been fuelled by the vast energy and infrastructure requirements needed for AI datacentres, as well as the record-breaking runs for gold and silver. Gold for example, rose from $2,600/oz. at the beginning of 2025, to $4,300/oz. by the end of the year. The unstable geopolitical outlook continues to underpin companies in the defence and engineering field4.
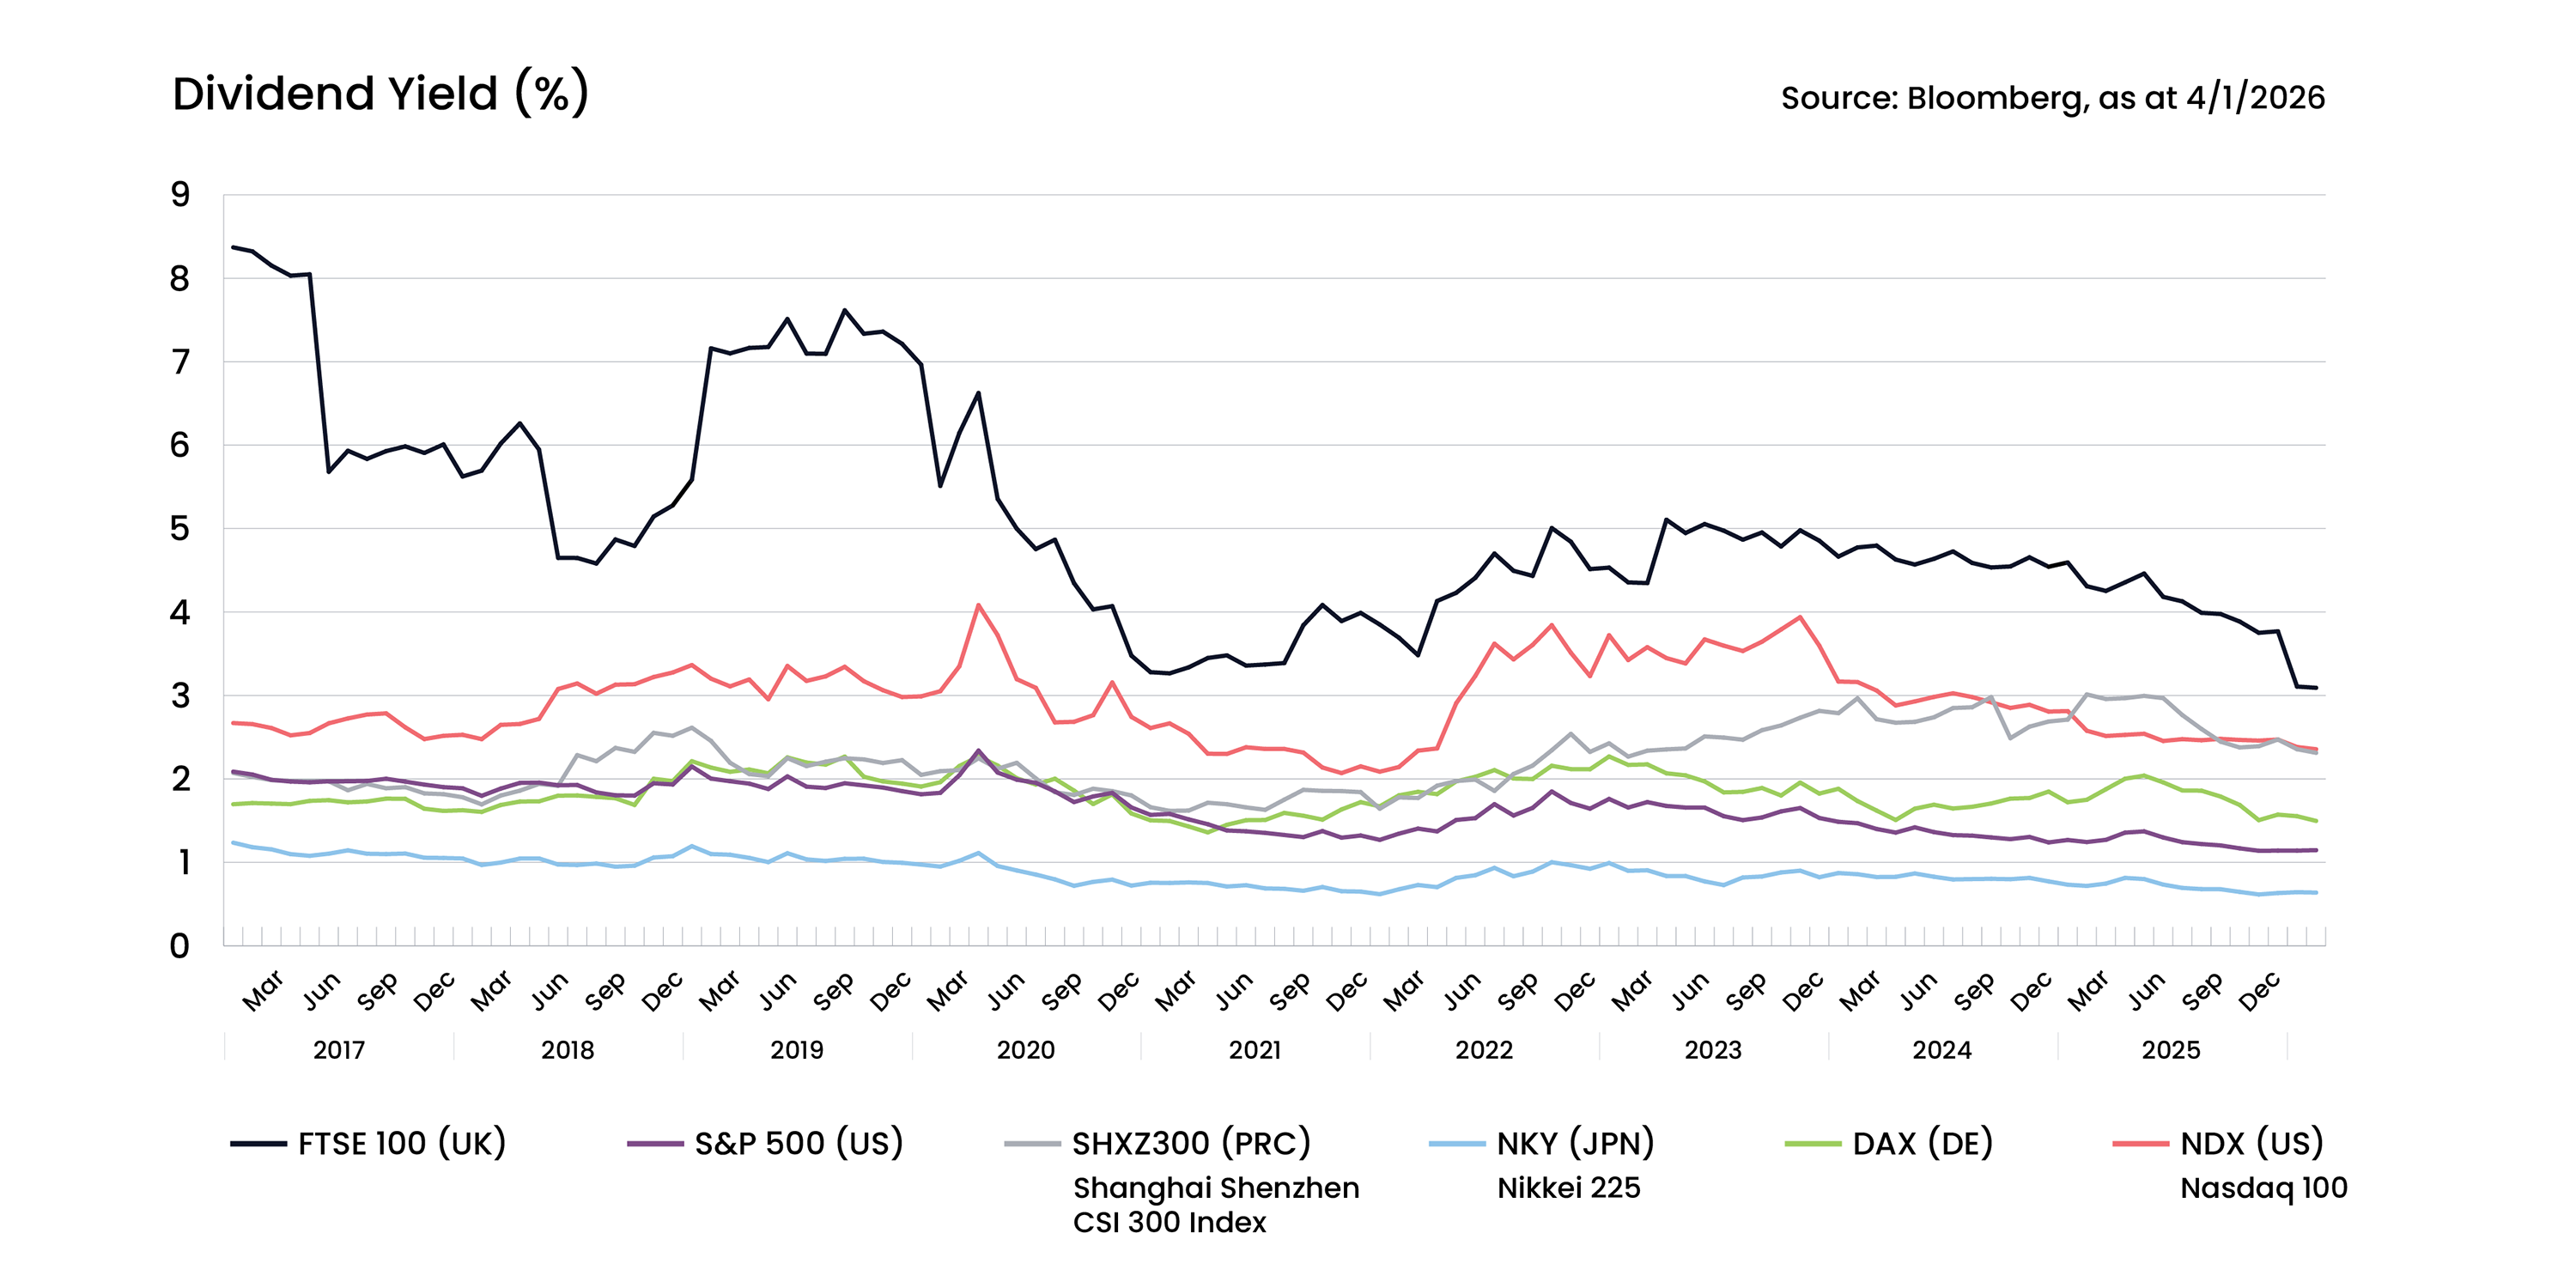
Many companies in these sectors reward shareholders with a relatively high share of their profits in the form of dividends. In contrast, growth companies in fast expanding sectors such as AI tend to provide low dividends to shareholders, preferring to retain their cash to help fund expansion. Over the long term, dividends can provide an important but less dramatic contribution to total returns than rises in share prices. The FTSE 100 offers the highest dividend yield compared to the US, Europe or Asia stock markets, as it has done for most of the last two decades.
The UK - generous dividend payouts compared to rivals
An investment sweet spot
Against the backdrop of further geopolitical uncertainty and high valuations in key high performing sectors in the US, it could be argued the FTSE 100 is currently in an investor sweet spot. It provides exposure to a range of sectors with lower price valuations beyond AI and outside the US. For example, the strong demand for base commodities (such as copper), as well as precious metals such as gold and silver support the mining sector, while financials will continue to benefit from a lower interest rate environment.
Many investors are increasingly drawn to the UK because they consider it an attractive proposition – one that trades at a lower value compared with key competitors. At the same time, the high dividend yields appear attractive when set against the prospect of lower interest and savings rates. The high proportion of defensive sectors provide an attractive safe haven should markets succumb to periods of heightened volatility.
While we cannot predict what the year ahead will bring, or how short-term sentiment will fluctuate, the UK market’s valuation and composition provides an attractive option for investors with a long-term mindset. This is something that will be welcome, not just by Rachel Reeves and Sir Keir Stamer, but by many investors too.
The value of an investment with St. James’s Place will be directly linked to the performance of the funds selected and may fall as well as rise. You may get back less than the amount invested.
Past performance is not indicative of future performance.
The information does not constitute advice and should not be relied on as such. It does not constitute a recommendation or an offer of solicitation. No responsibility can be accepted for an loss arising from action taken or refrained from based on this publication. All information presented herein is considered to be accurate at the time of production, but no warranty of accuracy is given and no liability in respect of any error or omission is accepted.
Sources
1MSCI ACWI - December 2025
2There are restrictions on how much foreigners can buy in Chinese shares, but MSCI indices are calculated on the available “free float” i.e. the proportion of a company’s shares for purchase by international investors. This is a major reason why China’s stock weighting relative to the UK and other countries is lower than the size of its economy would suggest - November 2025
3MSCI US & ACWI - November & December 2025
4Bloomberg - 4 January 2026
FTSE
Source: London Stock Exchange Group plc and its group undertakings (collectively, the “LSE Group”). © LSE Group 2026. FTSE Russell is a trading name of certain of the LSE Group companies, FTSE is a trademark of the relevant LSE Group companies and is/are used by any other LSE Group company under license. All rights in the FTSE Russell indexes or data vest in the relevant LSE Group company which owns the index or the data. Neither LSE Group nor its licensors accept any liability for any errors or omissions in the indexes or data and no party may rely on any indexes or data contained in this communication. No further distribution of data from the LSE Group is permitted without the relevant LSE Group company’s express written consent. The LSE Group does not promote, sponsor or endorse the content of this communication.
MSCI
Certain information contained herein, including without limitation text, data, graphs, charts (collectively, the “Information”) is the copyrighted, trade secret, trademarked and/or proprietary property of MSCI Inc. or its subsidiaries (collectively, “MSCI”), or MSCI’s licensors, direct or indirect suppliers or any third party involved in making or compiling any Information (collectively, with MSCI, the “Information Providers”), is provided for informational purposes only, and may not be modified, reverse-engineered, reproduced, resold or redisseminated in whole or in part, without prior written consent.
There are restrictions on how much foreigners can buy in Chinese shares, but MSCI indices are calculated on the available “free float” i.e. the proportion of a company’s shares for purchase by international investors. This is a major reason why China’s stock weighting relative to the UK and other countries is lower than the size of its economy would suggest.

Most popular articles


Most recent articles