

- News
Were the returns worth the risks in 2025?
Amid political turmoil and growing concerns over the size of tech stocks, global markets ended the year positively. How did SJP’s investment team navigate the complicated market environment?

At a glance
- Tech giants continue to influence markets but at what cost?
- Political events created pockets of volatility but equities continued to rise
- SJP unit trusts achieved on average double-digit gains in 2025, net of fund charges1.
It was a good year for equity markets in 2025 but not without risks. Concerns around those – political uncertainty and the dominance of tech companies – are still present at the start of the new year. Will the opportunities in 2026 outweigh these hangover risks?
Precious metals were among the best performing asset classes last year but so too were areas like technology stocks. The dual rise of such different asset classes highlights the complexity investors faced last year. Robin Ellis, SJP’s director of portfolio management, says inflation, concerns over government debt, AI, and the US’s tariff policy, all served to create heightened uncertainty. Simultaneously the ongoing growth of technology companies defied market concerns.
US tech giants – known as the Magnificent Seven – were front and centre through 2025 and remain a large consideration in the year ahead. Accounting for over a third of the global stock market, these companies have considerable sway over market movements – both positively and negatively. SJP’s chief investment officer, Justin Onuekwusi, says in his opinion they represent one of the largest concentration risks to investors. Underweight this area, Justin believes: “as these stocks continue to rise, the risk of holding them increases.”
Finding value
Expensive valuations, such as the US market, were concerning for SJP’s investment team last year and remain so today, he adds. Fundamentals like valuations mattered in 2025, Robin explains, leading to high dispersion between regions. Calling it a good year for active management, Robin and Justin say the team found value in regions such as Japan, UK, emerging markets and Europe.
Attributing the group’s strong performance in 2025 to active management decisions, Justin says allocations in SJP’s fund of fund ranges to other regions at the expense of the US added to gains. He notes: “We know valuations are the key driver of medium to long-term returns. Therefore, while US equities remain a cornerstone of global markets, and we continue to see strong opportunities there, we believed a much smaller allocation than the market weight was sensible.”
Overall, SJP’s unit trusts navigated the complexity of 2025’s investment backdrop with all achieving positive returns over the 12-month period. The weighted average return over the year was 14%, net of fund charges.1 This surpassed inflation by some 10%2 and outperformed cash (£) returns of 4.4% over this time frame.
These returns are only an example. They consist of 38 different funds, with different goals and risk levels and invested in different assets. As such, they shouldn’t be used to judge how suitable something is or how it might perform. They’re also not a benchmark so shouldn’t be compared to your own fund’s results, market indices, or other providers.
Over three years to the end of 2025, the average return across SJP’s funds was 13% per annum, net of fund charges. Extend that to five years and the figure stands at an 8% return a year. The five-year numbers exclude SJP’s largest fund range, the £90 billion Polaris funds, which launched in November 2022.
Over the long term
These numbers mean most SJP funds have beaten inflation in recent years.
While inflation-beating performance for one year is good, it is a relatively short period for assessment. Over the three years to December 2025, 37 of the 38 SJP funds with that much performance history beat UK inflation. Global Government Bond was the only outlier.
Over five years, this was a more difficult challenge as UK inflation hit a 40-year high. In the aftermath of Covid lockdowns, inflation peaked at 9.6% (in October 2022) and hovered at around 9% until April 2023. Still, well over half SJP’s range beat inflation over this time frame.
New charging structure
Last year also marked a first in SJP’s almost 35-year history. It is the first time its unit trusts have been able to be compared to peers on a like-for-like basis thanks to its new, cleaner charging structure. In November 2024 the group launched the S class for its unit trust range. This unit class only features fund costs, with advice and product charges separated. This net of fund charges performance calculation is the same used by other UK investment firms with respect to performance. This makes it more easily comparable to peers and easier for clients to see value, Justin adds.
Outlook for 2026
Given the strong performance in the technology sector last year – particularly AI – there are questions over whether this is an investment bubble? While Justin does not believe the data yet supports fears of an investment bubble, the team is alert to the fact market corrections are likely inevitable.
While market corrections might sound dramatic, they are more common than many people think, he says. “Falls of c10% happen once every three years on average. Meanwhile, falls of around 20% happen once every five years.” In other words, corrections are normal market behaviour, he points out, adding it is often in uncertain periods where some of the most compelling opportunities emerge.
“The key is to be prepared for the ups and downs and follow the basic rules – stay invested, stay diversified and do not fear the volatility. Market ups and downs create new opportunities for disciplined investors.”
Click here for Justin Onuekwusi’s latest CIO Insights.
Discrete annual performance over five years for SJP unit trusts
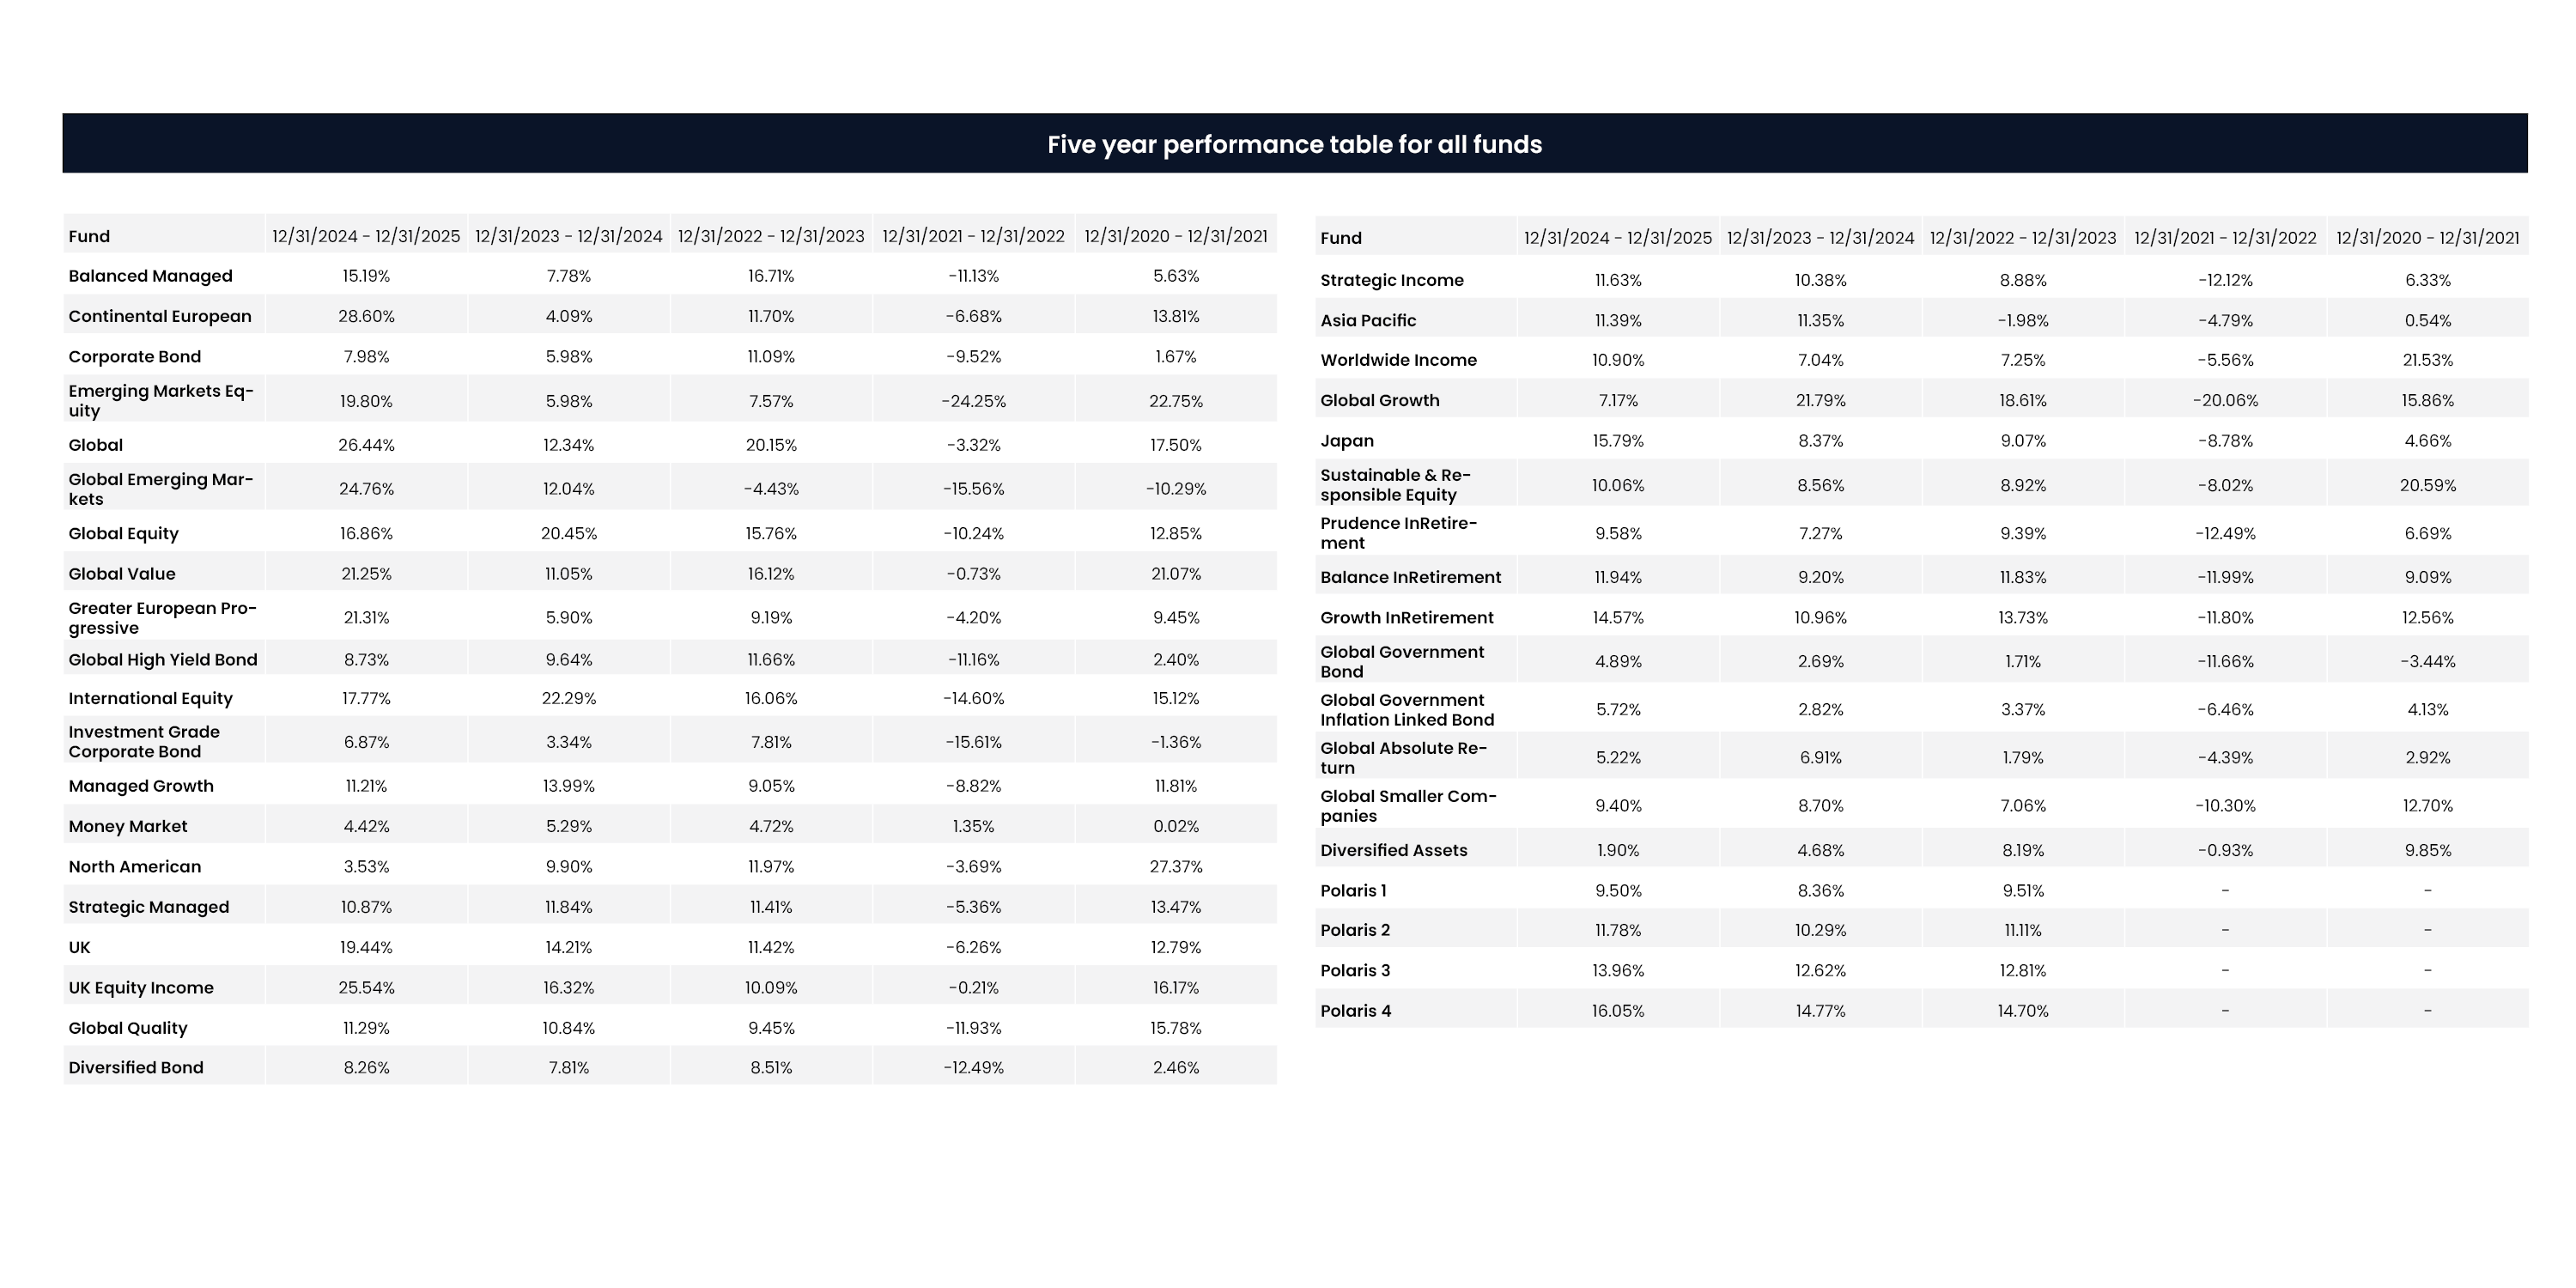
Source: Financial Express. Data as of 31 December 2025, shown bid-to-bid with income reinvested. Performance shown for the S Fee-Adjusted Acc classes. Figures shown are a composite of the new primary S class units, from 25 November 2024. Prior to this, L class units were used (R class is used for Global Government Bond), which included costs, such as advice and platform charges, which are not present in the S class. In this adjusted past performance calculation, we have adjusted for 0.775% per annum from actual L-class past performance, up to launch of S class to bring it closer in line with the net calculations of the S class. For the Money Market Fund, R class units are used prior to 25 November 2024, and we have adjusted historic performance by 0.5% per annum, reflective of the reduced advice and platform charges for this fund. The S Fee-Adjusted Acc units cannot be bought or sold.
Past performance is not indicative of future performance.
The value of an investment with St. James’s Place will be directly linked to the performance of the funds selected and may fall as well as rise. You may get back less than the amount invested.
Sources
1All SJP returns in this article are calculated using a weighted average. While a simple mathematical average treats all funds equally, the weighted average takes into account fund sizes. This means it weights the calculation towards the performance of the largest funds, the ones in which most SJP client assets are invested. For example: Fund A (£100 million in size) returns 5%, Fund B (£10 million) returns 25%. The simple average return of the two would be 15%; the weighted average would be under 7%. Likewise, if Fund A returned 25% and Fund B returned the lesser 5%, the weighted average would be higher – around 23% versus 15%.
2Inflation is based on the Office of National Statistics’ Consumer Prices Index including owner occupiers' housing costs figure of 3.6% as at December 2025.

Most popular articles


Most recent articles