

- News
- Investing
As widely expected, Chancellor Rachel Reeves has taken an axe to the annual cash ISA allowance in a bid to encourage UK savers to invest.
In Wednesday’s Autumn Budget Reeves announced the £20,000 annual cash ISA allowance would fall from £20,000 to £12,000, from April 2027.

At a glance
- The overall ISA allowance will remain at £20,000, but the cash ISA allowance will be reduced to £12,000
- The change is aimed at driving investment in UK equities
- The cut in the cash ISA allowance will only apply to the under-65s. It will remain at £20,000 for those aged over 65.
The move comes despite fierce lobbying from building societies concerned about deterring people from saving for house deposits via cash ISAs. Many savers are also concerned about being unable to put as much money in cash ISAs.
However, the annual allowance for investing in a stocks and shares ISA remains unchanged at £20,000. Reeves hopes that the £8,000 gap between how much people can put into a cash ISA and a stocks and shares ISA will encourage savers to turn into investors.
She also said she was working with financial services firms to provide people with new, easily navigable ways to find the right UK investments for them.
Alongside these changes, Reeves also announced a two percentage point increase in savings and property income tax for each band of taxpayers from April 2027. This will see the rate rise to 22% for basic rate taxpayers, 42% for higher rate taxpayers and 47% for additional rate taxpayers. There will also be a similar increase in the rate of tax levied on dividend income from April 2026, although this will only be for basic and higher rate taxpayers, not additional rate taxpayers.
Muddy waters
Reeves believes that a larger UK retail investor base would contribute to business funding and company growth, leading in theory to stronger public finances and bigger tax receipts. However, there is no guarantee that cutting the ISA allowance will drive more people towards investing in shares. Instead, those who are risk averse might look to products such as premium bonds.
But even before the announcement ISAs have been criticised for being too complex.
Since launching in 1999, the range of ISAs available to investors has expanded substantially, each with different rules, limits, tax and withdrawal treatments. Throughout this period, there have also been several changes to those rules.
Many have argued the ISA structure would be more appealing if simplified rather than restricted.
Claire Trott, Head of Advice at St. James’s Place, says: “A big issue with putting money into cash ISAs and stocks and shares ISAs is about making the choice. Once that choice is made, it’s not easy to make changes. This is yet another reason why the ISA system needs to be simplified: any added complexity will bring confusion to savers, and that could compromise people’s futures.”
But the complexity goes beyond the ISA landscape. There are multiple changes to taxation and allowances being phased in over a number of years. “Care needs to be taken not to act before we need to, acting too soon when details aren’t clear is just as risky as not acting at all,” Claire adds, referring to the changes announced that will either be subject to consultations or require significant legislative changes.
Making a behavioural bet
Figures show that cash ISAs are far more popular than stocks and shares ISAs. In the tax year 2023-24 there were just under 10 million new cash ISA subscriptions and 4.09 million of new stocks and shares ISA subscriptions.1
There is a chance that risk-averse savers could be tempted to simply put their money in deposit accounts after maxing out their cash ISA allowance, rather than running the risk of being exposed to market fluctuations.
However, as Claire points out, the reduction of the cash ISA allowance might prompt people to consider lower risk stocks and shares ISA. “There are so many ways people can invest in stocks and shares ISAs, and those who are averse to high-risk investments still have plenty of options within this space.”
Turning savers into investors
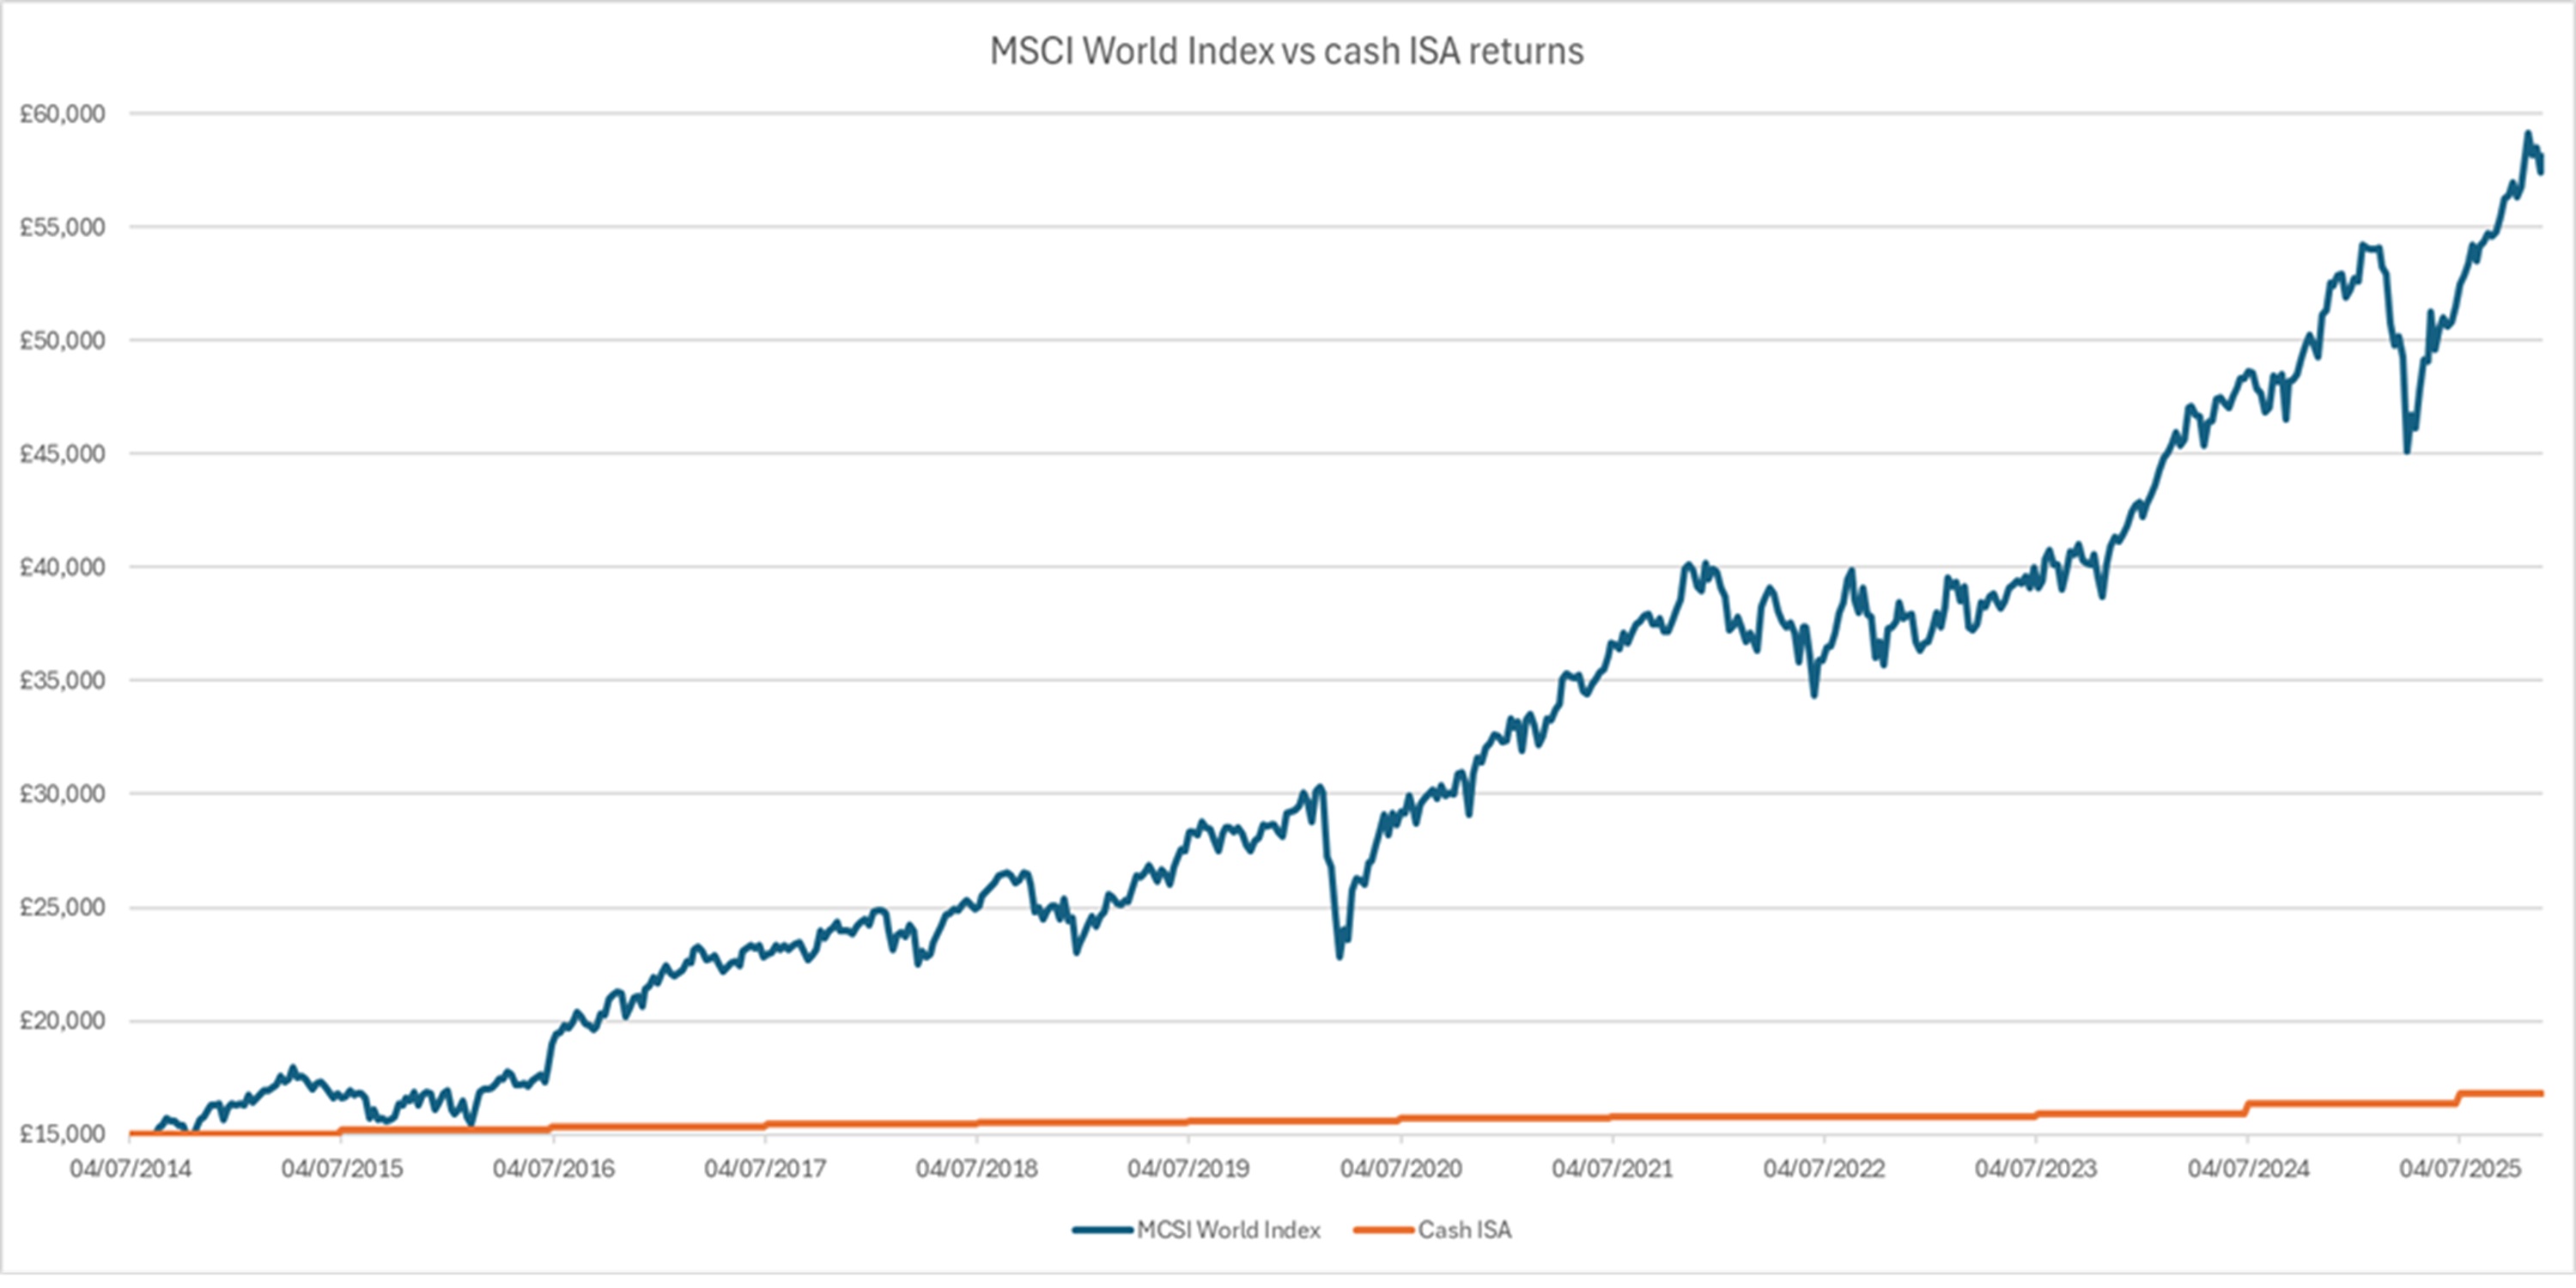
Chart: Cash ISA returns vs MSCI World Index returns. Based on £15,000 invested on 4 July 2014. Data as of 24 November 2025. Sources: Bloomberg, Bank of England.
Past performance is not indicative of future performance. Please note it is not possible to invest directly into the MSCI World Index and the figures shown do not take into account any charges applicable to the appropriate investment wrapper or any relevant tax charges.
A saver who contributed £15,000 to their cash ISA on 1 July 2014 (the date cash and stocks and shares ISAs were given equivalent limits) would see their pot grow to £16,800 by 24 November 2025. These figures are based on Bank of England data on interest rates of sterling cash ISA deposits.2
On the other hand, a £15,000 investment into a MSCI World Index tracker fund through a stocks and shares ISA would have grown to £58,097 over the same period. Please note that it is not possible to invest directly into the MSCI World Index. The calculation also does not take into account any fees and charges associated with taking out an ISA wrapper.
With these announcements adding yet more complexity to financial matters, the importance – and value – of financial advice has never been as clear. Find a financial adviser today.
The value of an investment with St. James's Place will be directly linked to the performance of the funds selected and may fall as well as rise. You may get back less than you invested. An investment in a Stocks and Shares ISA will not provide the same security of capital associated with a Cash ISA. You must also bear in mind that over the long-term inflation will erode the purchasing power of the capital.
The favourable tax treatment of ISAs may not be maintained in the future and is subject to changes in legislation.
Cash ISAs are not available through St. James's Place.
Sources
1Commentary for Annual savings statistics: September 2025 - GOV.UK
2Bank of England database
Certain information contained herein, including without limitation text, data, graphs, charts (collectively, the “Information”) is the copyrighted, trade secret, trademarked and/or proprietary property of MSCI Inc. or its subsidiaries (collectively, “MSCI”), or MSCI's licensors, direct or indirect suppliers or any third party involved in making or compiling any Information (collectively, with MSCI, the “Information Providers”), is provided for informational purposes only, and may not be modified, reverse-engineered, reproduced, resold or redisseminated in whole or in part, without prior written consent.
BLOOMBERG®” and the Bloomberg indices listed herein (the “Indices”) are service marks of Bloomberg Finance L.P. and its affiliates, including Bloomberg Index Services Limited (“BISL”), the administrator of the Indices (collectively, “Bloomberg”) and have been licensed for use for certain purposes by the distributor hereof (the “Licensee”). Bloomberg is not affiliated with Licensee, and Bloomberg does not approve, endorse, review, or recommend the financial products named herein (the “Products”). Bloomberg does not guarantee the timeliness, accuracy, or completeness of any data or information relating to the Products.

Most popular articles


Most recent articles